The London Building Stock Model and the London Solar Opportunity Map
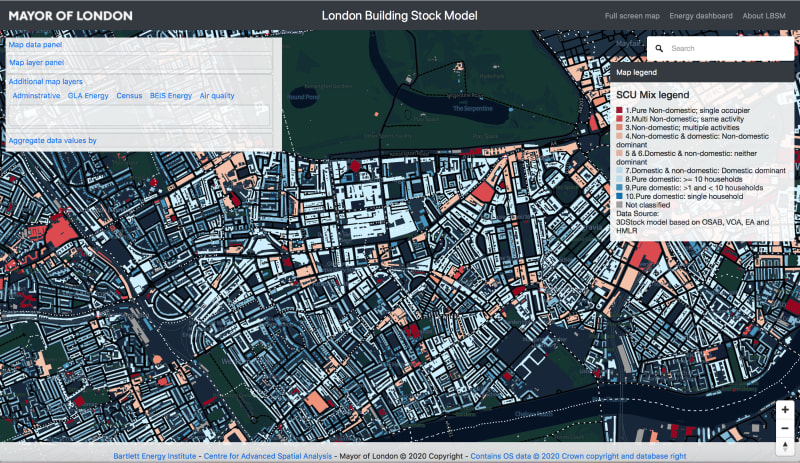
The London Building Stock Model (LBSM) has been developed for the Greater London Authority by a team at the UCL Energy Institute and the UCL Centre for Advanced Spatial Analysis. The work has been carried out by Stephen Evans, Dominic Humphrey, Daniel Godoy-Shimizu, Rob Liddiard, Paul Ruyssevelt and myself. LBSM, which derives from the team’s 3DStock model, was delivered to the Authority in 2020. It is made available to the GLA and Boroughs in 2D map form through a web interface, and to the general public through a second interface.
The Model contains detailed data on every separate domestic and non-domestic building in the 33 Boroughs of Greater London. It includes three-dimensional information about buildings including their heights, volumes, wall areas, and the distribution of activities between different floors. Other information is attached, on the ages of buildings, their materials of construction, and (in some cases) their servicing systems. Energy Performance Certificates (EPCs) and Display Energy Certificates are attached to premises; and premises that lack Certificates are assigned ‘virtual EPCs’, estimated statistically from building characteristics and location. In a second phase of development in 2020/2021, benchmark values for annual electricity and gas use, calculated from actual consumption, will be attached to all dwellings and premises.
The Model is being used by the GLA and London Boroughs to tackle fuel poverty and improve the energy efficiency of the capital’s housing stock. It supports Boroughs in their enforcement of the Minimum Energy Efficiency Standard (MEES). It allows poorly performing non-domestic buildings to be identified, and can help small and medium sized enterprises, and individual property owners and householders, to make energy improvements to their premises and reduce their energy bills.
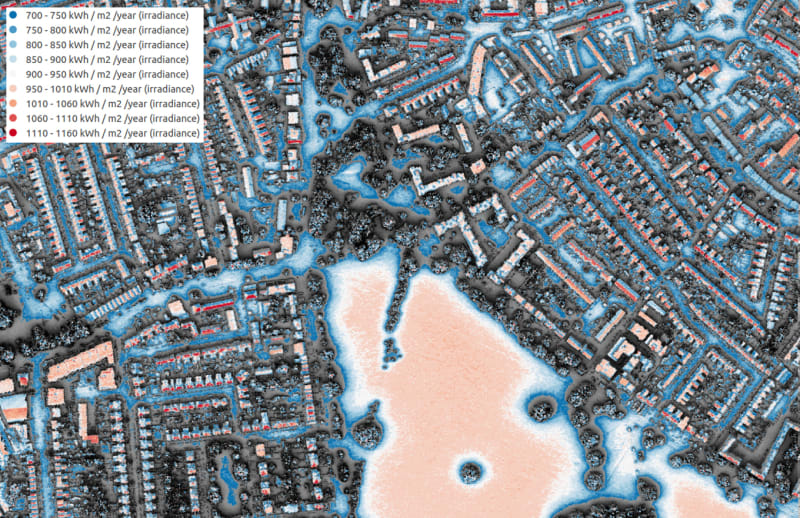
In a further development in 2020, the London Solar Opportunity Map (LSOM) will be added, giving figures for the direct and diffuse solar radiation falling on all roofs and areas of open land. The Map will give estimates of the potential electrical or thermal output of solar installations. LSOM will link to the London Building Stock Model, giving information about buildings beneath the roofs, and the uses and character of land areas.
Both the Model and the Map are online at the links below. Click on the boxes below the images to get full screen